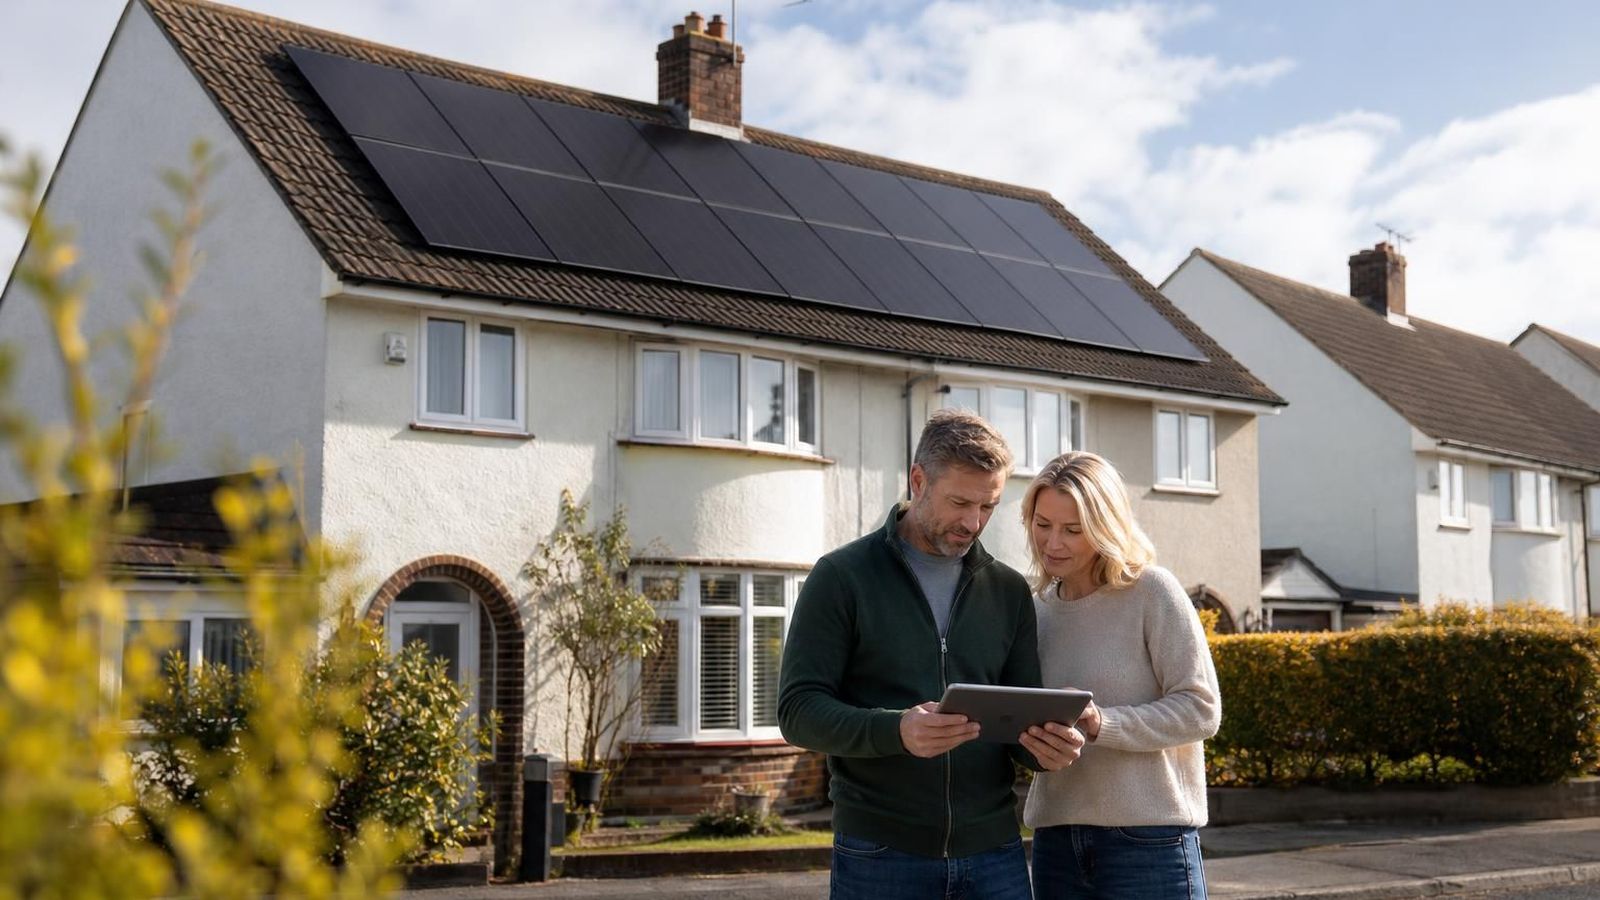
Daytime demand changes the value of the same generation
Consider two illustrative homes each using 4,000 kWh a year, generating 3,600 kWh and paying GBP 6,000 for solar. At assumed import/export rates of 30p/15p, using 20% directly gives GBP 648 annual benefit; 60% direct use gives GBP 864. These are changed direct-use assumptions, not observations of real households.
More daytime use avoids more imports and leaves fewer exports. It helps financially in this example because imports cost more than exports earn. If those rates converge, shifting use matters less. Annual kWh cannot prove that the home can actually use the assumed share when the panels produce it.
A battery can weaken the investment case
In the central example below, solar alone gives GBP 756 annual benefit. Diverting 1,000 kWh of exports through a 90% efficient battery adds only GBP 120 at the example rates. A GBP 3,000 additional purchase then has 25-year simple payback, outside the selected 10-year battery horizon.
With export worth 30p and import still 30p, the same battery loses GBP 30 a year before maintenance: it gives up more export value than its delivered energy avoids. A combined-system payback cannot show that the battery itself is worthwhile. Compare battery costs and additional return.
A shorter time in the property changes the decision
If you expect to move before a simple payback date, do not assume the outstanding cost will be recovered in the sale price. No property-value uplift is included in our model. Check your cash available, likely ownership period and need for roof work alongside the energy estimate.
A low-use home, expensive access, significant shading or generous export payment can make a battery particularly weak. Solar may still help, but a smaller or simpler proposal deserves comparison. Test the actual quotation and a less favourable scenario before relying on one sales illustration.
What a favourable result still needs
A calculator result is an annual scenario. Verify the survey, technical design, network arrangements and contract independently. Allow for ownership costs and replacement risk instead of assuming the first year repeats perfectly for decades. Check the proposal’s assumptions and ask the installer to explain any disagreement with your own numbers.
Worked scenarios from the shared model
Synthetic examples, not measured installations or current offers. Each assumes 3,600 kWh generation, 4,000 kWh household demand, GBP 6,000 solar cost, 30p import, 15p metered export and zero additional annual operating cost. Direct-use shares vary. No tariff escalation, degradation or replacement is included.
| Scenario | Annual total benefit | Solar / combined simple payback | Additional battery payback |
|---|---|---|---|
| Lower daytime use | GBP 648.00 | 9.3 years | No battery |
| Central solar only | GBP 756.00 | 7.9 years | No battery |
| Higher daytime use | GBP 864.00 | 6.9 years | No battery |
| Central with additional battery | GBP 876.00 | 10.3 years | 25.0 years |
The battery example diverts 1,000 kWh from exports, delivers 900 kWh after 100 kWh losses and costs an additional GBP 3,000. The battery adds GBP 120/year and does not recover its cost within the selected 10-year horizon. High export prices can reduce or reverse this benefit. See equations and limits.
Sources and review dates
Research-based guidance. Source checks do not imply product testing or verification of an individual installer.
- Energy Saving Trust: Solar panels. Solar suitability, generation, roof and installation considerations; not a local quote dataset. Scope: UK. Checked .
- Energy Saving Trust: Battery storage. Storage losses, scope of cost estimates and possibility that savings do not justify battery cost. Scope: UK. Checked .
- Ofgem: Smart Export Guarantee. Eligibility and supplier-set export terms; export payments are not installation grants. Scope: Great Britain. Checked .
Registry sources-2026-11-01. Tariffs have a 30-day internal review interval. Methodology and assumptions.